Back to Results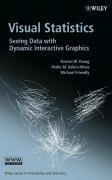
—out of 5—out of 5—out of 5—out of 5—out of 5—out of 5
Magical Tome
- First published
- 2014
- Publisher
- Wiley & Sons Canada, Limited, John
- ISBN
- 9781283279956
Visual statistics
The outer archives are busy
About this book
"Visual Statistics brings the most complex and advanced statistical methods within reach of those with little statistical training by using animated graphics of the data. Using ViSta: The Visual Statistics System - developed by Forrest Young and Pedro Valero-Mora and available free of charge on the Internet - students can easily create fully interactive visualizations from relevant mathematical statistics, promoting perceptual and cognitive understanding of the data's story. An emphasis is placed on a paradigm for understanding data that is visual, intuitive, geometric, and active, rather than one that relies on convoluted logic, heavy mathematics, systems of algebraic equations, or passive acceptance of results."--Jacket.
Match Score
Create a free account to see Match Scores on books the community has marked — once you’ve set your preferences.
Create free accountMarks of the Realm
Marks left by readers of this tome
No community marks yet — be the first to inscribe this tome.
Pacing
Horror / Dark Elements
Romance
Spice Level
LGBTQ+ Representation
Social & Political Themes in Stories